Introducing Runecast Analyzer version 2.0
We are excited to share that Runecast Analyzer is generally available in version 2.0. This latest version greatly increases the visibility over VMware environments so system administrators can more easily ensure their systems are operating at optimum performance all the time in order to deliver on their business requirements.
This release brings following new functionalities:
- Ability to store and display all detected and resolved issues over time for every connected vCenter.
- The completely new monitoring dashboard with The Most Affected hosts and trending.
- Automation of PCI-DSS VMware rules and new PCI-DSS profile UI
- Support for vSphere 6.7 HTML5 plugin
- Usability, performance and security improvements for increased ease of use.
- Latest VMware Knowledge Base updates.
Keeping track of issues within environments such as ESXi, vSphere, vSAN etc. can be very time-consuming. With the latest version of Runecast Analyzer, there are many new exciting features to aid admins in monitoring these environments. One of the key features is the ability to monitor the history of all issues associated with an infrastructure over a certain period of time. This feature will be very beneficial in increasing efficiencies and reducing admins' time in managing their environments.
Vladan Seget | ESX Virtualization | IT Consultant, blogger, vExpert

Let's have a closer look at what's new in 2.0:
Historical Trending
Runecast Analyzer 2.0 is now capable to store at least 3 months of vCenter, vSAN and NSX-V scan results, including issue description, IP Address or findings (why the issue was detected). This allows system admins to use Runecast as a standard monitoring solution for the continuous threat protection and troubleshooting. Runecast Analyzer scans every connected vCenter every day by default and provides trending information on the dashboard. The frequency of scans can be customized or triggered manually outside the scheduled window.
Configuration issues/KB applicable:

VMware security hardening:

Best practice adoption:

All detected issues summarized on a daily or weekly view:
.png)
Historical Analysis
Historical Analysis is a completely new functionality released in version 2.0. The main objective is to help VMware administrators to isolate the root cause of the reported incident as fast as possible and detect new problems caused by product update or configuration changes. This functionality is available in "Issue List" (accessible from the main menu) or upon a drill down click of the following widgets: "Issues by severity", "KBs applicable", "Issue History" and "Configuration Issues by Layer".
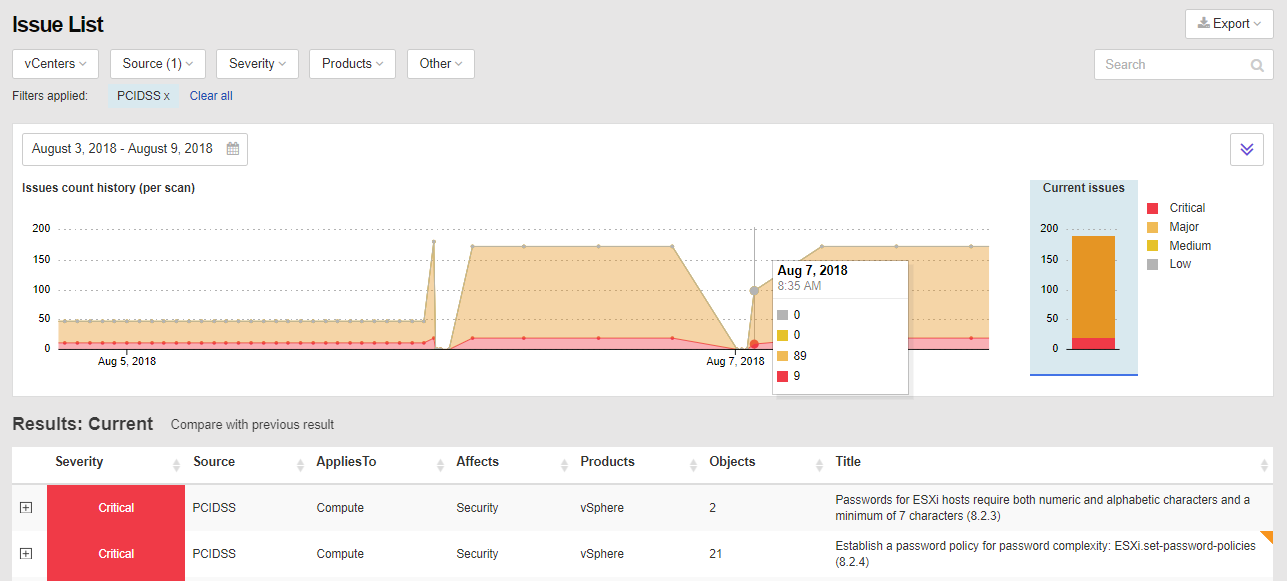
Here is how the new "Issue List" looks like:

The Issue List now consists of two sections. First one is a chart showing a trend of detected and fixed issues over time. The second one is a table with detailed description of the issues. Dots on the chart areas are interactive and upon a mouse click, show issues and details from that particular scan in the table below. The chart supports zoom-in/out and mouse drag for easier navigation in selected time-range. When a VMware admin clicks Compare with Previous results, Runecast Analyzer shows a comparison summary between selected and previous scan, as shown below:

Thanks to this "diff view", VMware administrators can quickly uncover new problems and impacted devices (hosts, vCenters, VMs, NSX or vSAN). This view will come in handy during typical maintenance windows or configuration updates. It will help sort out which devices have been fixed and identify if an issue is still prevalent or if any new issue appeared. IT teams will find it useful for improved planning to identify which configuration changes needs to be done in the next maintenance window.
Summary of the use cases:
- Identify which configuration change or software update caused an issue.
- Isolate and focus on the correct root-cause during incident troubleshooting.
- Plan and validate VMware maintenance activity details
- Automate security and best practices violations and compliance reporting.
- Identify violations against a baseline (golden image).
PCI-DSS Automation for VMware
Payment Card Industry Data Security Standard also known as PCI-DSS can be a nightmare for many system administrators for its complexity and vague description of what exactly has to be checked, especially on VMware products. On the other side, all institutions that are involved in payment cards should comply with this standard. It is for the administrators in such organizations that we built the new PCI-DSS security profile in Runecast Analyzer. The administrators can enable automatic PCI-DSS rule check against their VMware setups and fix detected standard violations. Although Runecast Analyzer cannot guarantee full compliance even when all PCI-DSS checks pass, it will greatly speed up the PCI-DSS implementation and together with historical trending functionality, it will provide continuous monitoring against PCI-DSS violation on VMware. To enable PCI-DSS in Runecast Analyzer:
- In Settings, enable PCI-DSS profile
- Select one or all vCenters and click Analyze button
- Go to Security hardening menu and click PCI-DSS
Example of detected PCI-DSS issues:

Administrators familiar with PCI-DSS may notice specific attributes related to this standard such as ControlID or Milestone (a type of severity). Runecast data engineers went through entire PCI-DSS specification and extended the rule description in a manner that will help administrators understand how it contributes to the standard criteria. The issues can then be fixed using Technical Description tab within PCI-DSS rule detail:

Last, but not least, since Runecast Analyzer 2.0 continuously monitors VMware environments, it allows administrators to prove the security profile persistency by using the Issue list and the issue history chart. You will find this feature handy next time you speak to your security team.
New Dashboard and Usability Improvements
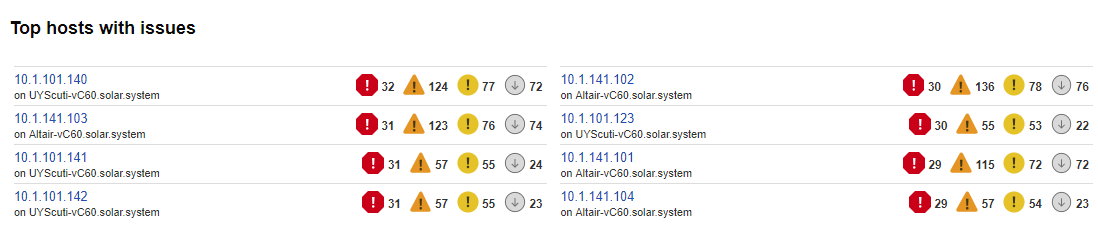
With such a load of new functionalities in version 2, we have decided to create a new main dashboard and to improve the usability of frequently used UI parts of Runecast Analyzer. The new dashboard contains historical trending information and a new widget displaying your ESXi hosts with most issues. All widgets are interactive and the administrator can drill-down to reveal specific details.
The new "ESXi hosts with most issues" widget:
The new dashboard:

New interactive filters in "Issue List"
Runecast Analyzer supports vSphere, vSAN, NX-V and multiple security hardening standards. With the introduction of PCI-DSS and historical analysis functionality, filtering the issues relevant to you is very important. That is why Runecast Analyzer 2.0 introduced more interactive filters in issue list where the selected filter attributes are pinned to the headline. The filter is interactive and when changed it immediately applied to both the chart and the issue table:

In addition Runecast Analyzer 2.0 now has:
- new memory function in the Inventory tree view
- Ignore button has been moved from the side of every issue to just under the issue details
- new type of severity icons
- table paging
- menu navigation improvements
vSphere 6.7 HTML5 Plugin
As you know Runecast Analyzer supports vSphere 6.7. With version 2.0 this support has been extended to the vSphere 6.7 HTML5 web-plugin. The installation of this plugin is simple. Go to the Settings -> vCenter connections -> Select vCenter 6.7, click the wrench icon and select Install plugin or Update plugin:

How Can I Install Runecast Analyzer 2.0?
I am a new user:
The simple method is to register at portal.runecast.com/login, download the .OVA file and find a where you can deploy it. The installation process is very straightforward and described in Runecast Analyzer user guide. You can also watch the short configuration tutorials videos.
I am an existing user:
Version 2.0 comes with improved platform, new under the hood components for better performance, stability, and security over versions 1.x. That is why in-place upgrade from 1.x to 2.0 is not available. If you do not have an extensive list of filters or KB notes, you can simply deploy 2.0 as a brand new appliance and connect it to your vCenters. In case you have filters and notes defined, please reach out to roi@runecast.com and we will help you migrate your setting.
Michal Hrncirik | Head of Product Management, vExpert
Click to view larger image ↑
Click to view larger image ↑
Click to view larger image ↑
Click to view larger image ↑
Click to view larger image ↑